Dashboard example
- Dashboard to the needs of the client
- View key data center performance in one place
- Monitoring of PUE and energy consumption
- Ability to connect existing buildings and systems
View data in dynamics
- View data as a graph
- Ability to print and save data for further analysis
- The ability to monitor data center data will in the future identify problems in the initial stages
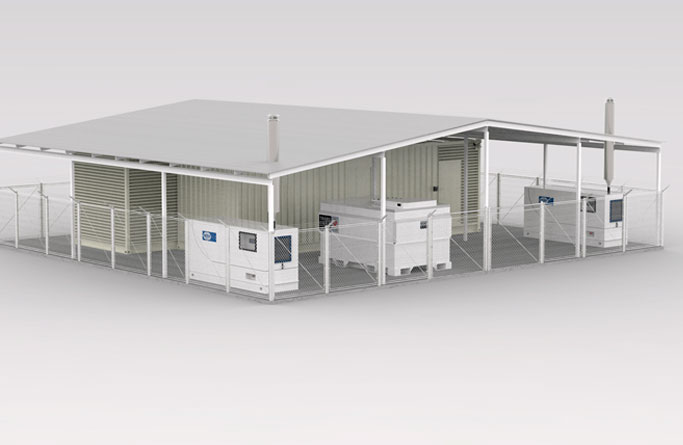
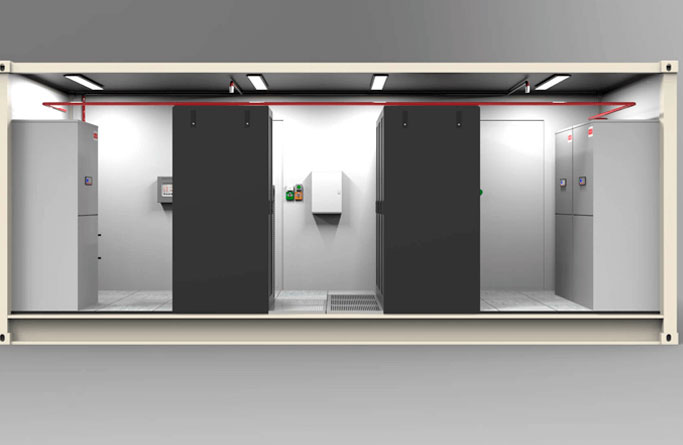
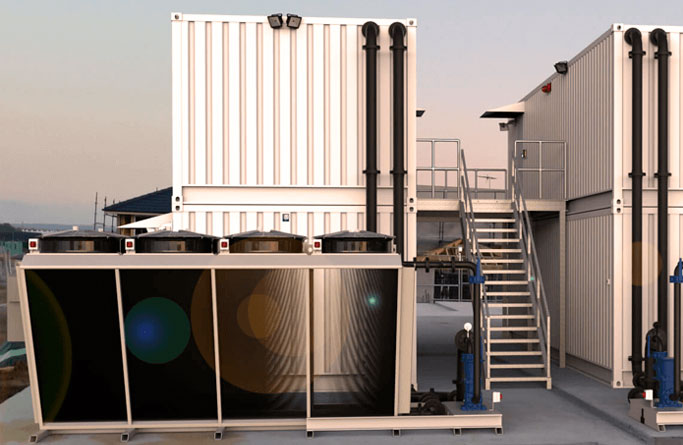
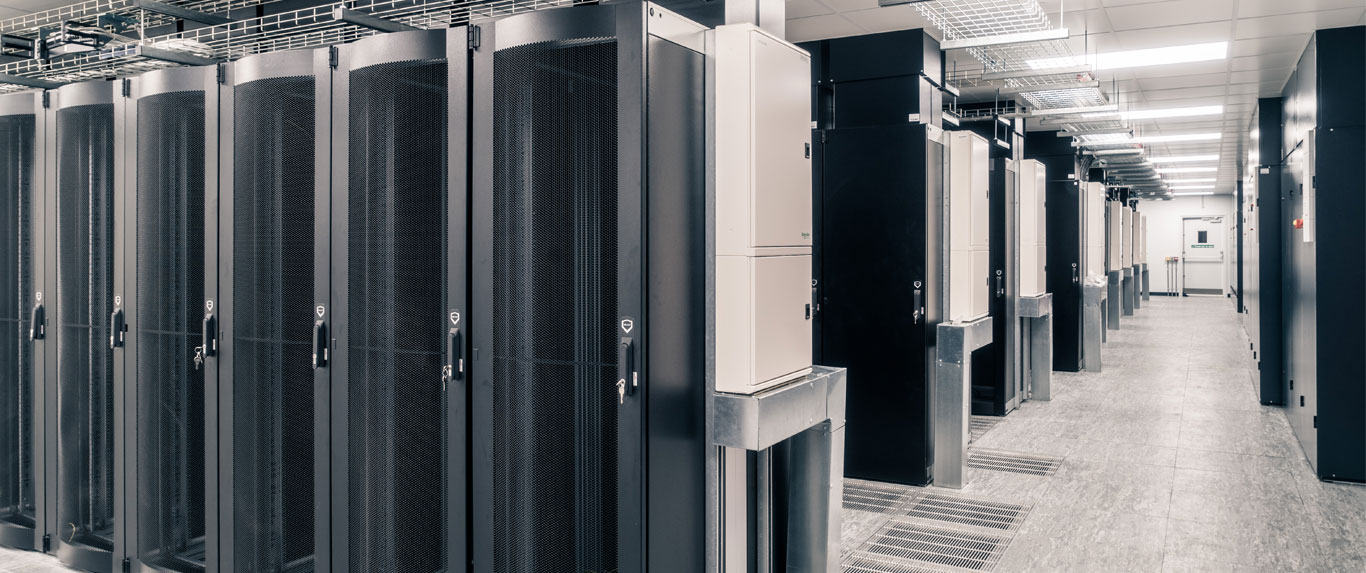
Modular data center
- High performance
- Cost effective
- For the construction of ceilings and walls using pre-prepared panels
- Fast deployment
- Can be built both indoors, buildings, hangars, and on the street
- Energy efficient, safe solution with the possibility of expansion
- Securiclad panels have a maximum rating of 4 (SR4), when measured on a safety scale from 1 to 4
- Ideal for protecting servers, IT equipment and other sensitive data from physical damage
- Designed to withstand the effects of tools, including drills, gas burners, sledge hammers, axial planers, jigsaws, disc grinding machines
Automated Monitoring System (AIMS)
- Monitors the environment
- Warns users of emergency events via SMS, e-mail or external light and / or sound alarms
- Rack Mounted
- Up to 16 RJ45 sensors and 8 digital inputs
- Collaboration of 5 devices (1 Master and 4 Slaves)
- Many custom configurations
Data Center Infrastructure Management Software (DCFMS)
- Installs on a remote PC
- Access via browser is possible
- Connects to network devices via SNPM and Modbus
- Data Center Visualization
- PUE calculation and real-time energy consumption
- Detailed dynamics
- Notification via e-mail when thresholds are reached
Alarm Configuration
- Receive alarms by multiple users via e-mail or SMS
- Alarm thresholds are customizable
- Connects via a protocol to measure the level of power consumption of racks and critical load; in case of an increase in the level of power consumption, it sends messages


 We are on the map